A Drill Stem Test DST is basically a way to test an oil and gas well by performing a transient response on the producing formation. It is also a temporary completion of the well while the drilling rig is still in place. The DST is analyzed to determine what service work (usually by Halliburton) needed to be done to complete the well. Halliburton was performing around 6,000 DSTs each year and the DST was the “foot in the door” to do the upcoming service work typified by fracturing or acid treatment. I did not think about it too much at the time but I believe we could have had a blank check for almost anything we wanted because this project was so important to the future growth of Halliburton’s Oil Field Service business.
The test results were recorded on a 4” by 5” metal chart that were scribed in the well by a stylus similar to a phonograph needle scratching a record of pressure vs time during the test. At this time, everything in the testing operation was done mechanically. The testing was recorded in an assembly with the metal charts wrapped inside a tube with a Bourdon Tube pressure sensor and a clock. The chart recorder was a small component in elaborate testing tools such as packers and valves which Halliburton had designed.
These charts were typically mailed in to the main Testing Department Office to be read manually on Kuster microscope chart readers. The charts were processed through a company photo lab and prints were made and the backs of the photos waxed so the photos could be ironed into manually written reports which would then be mailed or couriered to the owner of the wells. Many of the wells had drilling rigs that cost as much as $50,000 per day while on site. Obviously, shortening the delivery time for the test results could provide a major savings of both time and money for each well. Halliburton would have a very strong competitive edge by shortening the time to get results from several days to around four hours. The capability of transmitting the test results electronically did not exist in the industry and that ability would be a compelling competitive edge for Halliburton.
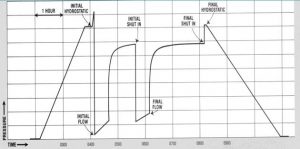
Here is an example of a chart made during a drill stem test. The two sloping lines on the beginning and end of the chart are readings as the hydrostatic pressure from the drilling mud as the tools are lowered to the depth of the formation being tested. The actual test data is between the initial hydrostatic and the final hydrostatic. Much of the data compression achieved through pattern recognition was to consider these parts of the chart to be “picture only” and would be captured at much lower resolution than the parts of the test that needed to be recorded and transmitted at resolution of 0.0005 inch by 0.001 inch.
The goals of this project can be summarized as follows:
* Read the charts to an accuracy of 0.0005” x 0.001” accuracy for the period of the test.
* Transmit the results to this accuracy back to the Testing Department for analysis
* Provide a mechanism for test activities and descriptions to be transmitted and recorded audibly
* The data transmission was to be done using acoustic couplers even from phone booths in under five minutes. Speed of the acoustic couplers was 300 baud, approximately 30 characters per second.
* This meant that data compression of 6,000 to 1 had to be done in the chart reader.
* Provide a mechanism for graphic editing of the chart data in Halliburton testing offices to eliminate extraneous scratches and other defects.
* The graphic editing was to be done on a Tektronics 4014 graphics terminal as several thousand spots, Putting the points on the screen fast enough was one of our biggest technical challenges. Technical details for this process are discussed here.
* Eliminate the need in the Test Department for copiers to be used in making all the copies of the reports to return to the customer. If a customer needed 10 copies of the report, our system would make 10 original copies. [This requirement became one of our biggest challenges because the time to produce the text and graphics was so long that recomputing the layout of the reports would take an inordinate time and would greatly decrease the productivity of the test analytical team.] The state-of-the-art for copiers at this time would not be satisfactory to Halliburton Customers.
* The Test Department needed the in-house system to run fast enough to prevent backlogs from ever happening.
The biggest challenge of all was the computers and equipment available were not capable of doing much of what was expected. The most basic need was a scanner that would read the 4” by 5” metal charts that were recorded down-hole during the actual test.